| per4m | ||
| .gitignore | ||
| README.md | ||
| setup.py | ||
Profiling and tracing information for Python using viztracer and perf, the GIL exposed.
This project aims to (at least demonstrate) how to combine the Linux perf tool (aka perf_events) with viztracer to visualize the GIL (rather process states) and various profiling statistics, or hardware performance counters.
Installation
From PyPy
$ pip install per4m
Usage
$ per4m giltracer -m per4m.example2
Open the result.html, and identify the problem (GIL visible, possible low instruction counts/cycle):
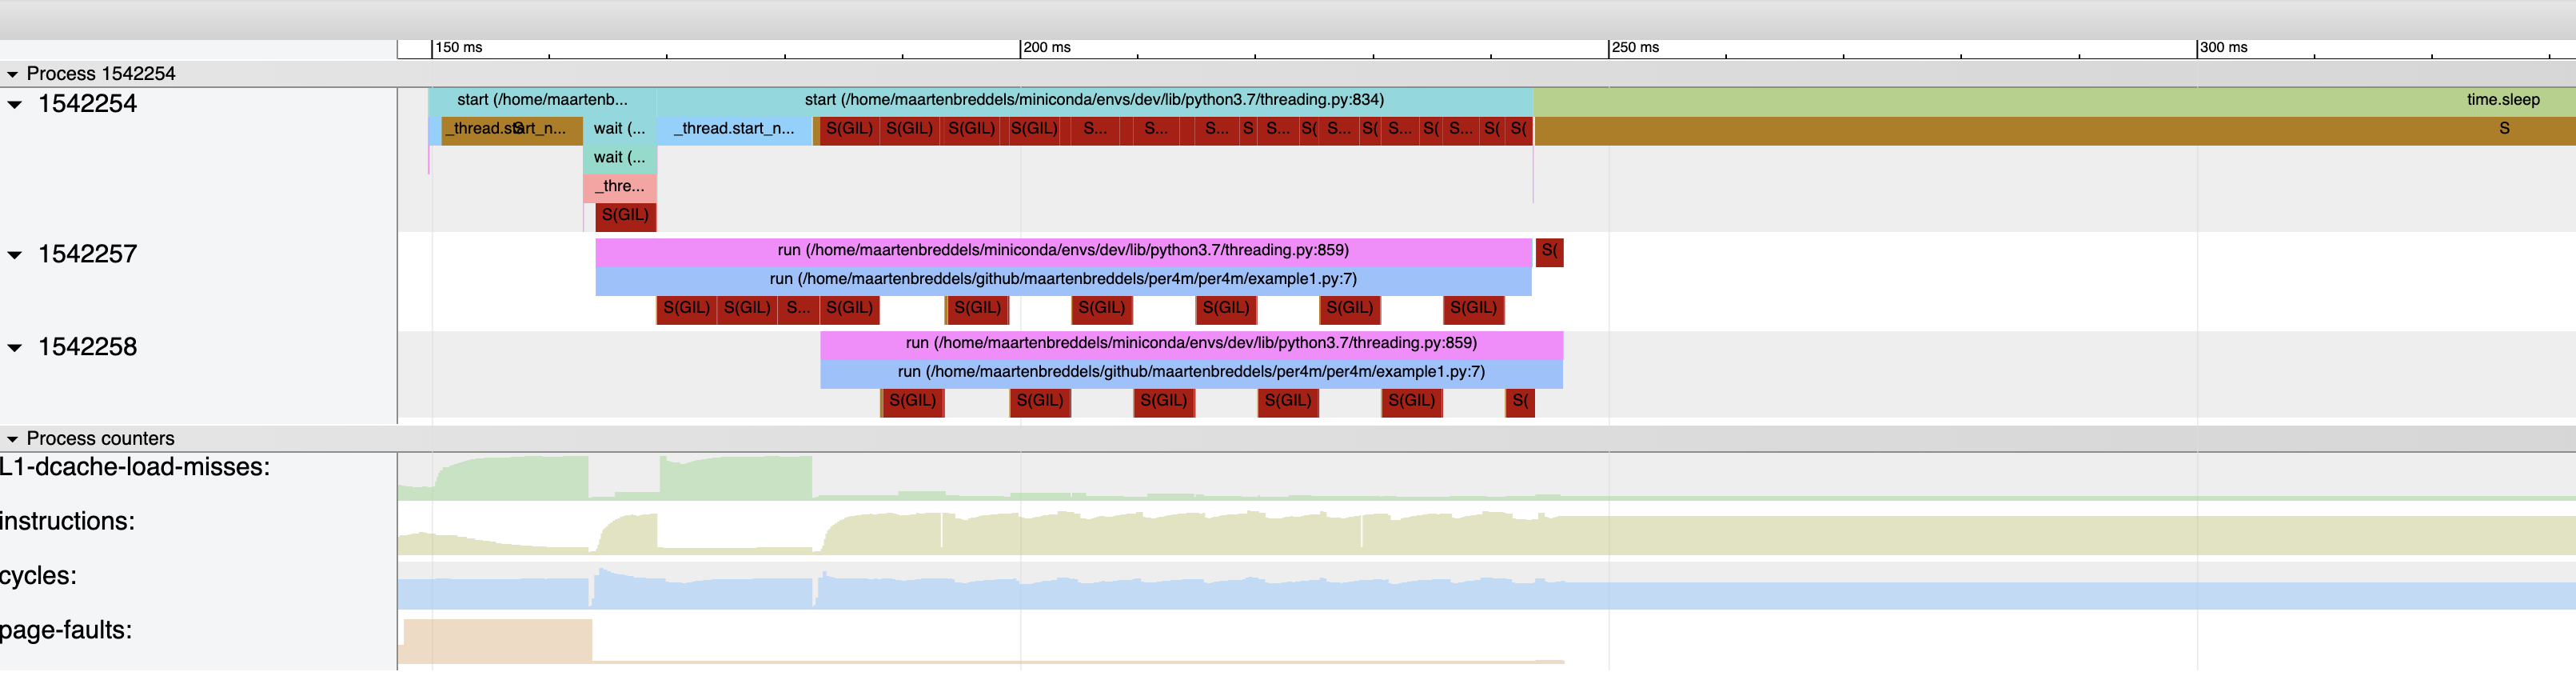
The dark red S(GIL) blocks indicate the threads/processes are in a waiting state due to the GIL, dark orange S is a due to other reasons (like time.sleep(...)). The regular pattern is due to Python switching threads after sys.getswitchinterval (0.005 seconds)
Usage - manual
Step 1
Create a script that uses viztracer to store trace information:
import threading
import time
import viztracer
import time


def run():
    total = 0
    for i in range(1_000_000):
        total += i
    return total


with viztracer.VizTracer(output_file="example1.json"):
    thread1 = threading.Thread(target=run)
    thread2 = threading.Thread(target=run)
    thread1.start()
    thread2.start()
    time.sleep(0.2)
    for thread in [thread1, thread2]:
        thread.join()
Step 2
Run and trace scheduler events from the kernel (to capture GIL information) and measure hardware performance counters
$ perf record -e 'sched:*' --call-graph dwarf -k CLOCK_MONOTONIC -e L1-dcache-load-misses -e instructions -e cycles -e page-faults -- python -m per4m.example1
Loading finish
Saving report to /home/maartenbreddels/github/maartenbreddels/per4m/example1.json ...
Dumping trace data to json, total entries: 76, estimated json file size: 8.9KiB
Report saved.
[ perf record: Woken up 139 times to write data ]
[ perf record: Captured and wrote 26,139 MB perf.data (3302 samples) ]
Step 3
Convert perf.data to Trace Event Format
$ perf script --no-inline | per4m perf2trace --no-running -o example1perf.json
Step 4
Merge the viztracer and perf/per4m results into a single html file.
$ viztracer --combine example1.json example1perf.json -o example1.html